
Logstalgia
As any system admin knows, every log tells a story and you can never have too many logs. Unless of course those logs are filling up your disk and you forgot log & alert that! As systems get more complex, it can quickly become time consuming to trawl through log file after log file. While there are numerous tricks to doing so efficiently, but multiply that by 10’s or 100’s or 1000’s of servers and you can quickly drown in a sea of data no matter how much of a bash wizard you are.
At Crucial we use a number of creative options, combining customised monitoring tools/scripts and real-time log monitoring for our own internal systems as well as individual customer systems. Log aggregation is an increasingly important necessity as virtualization & the cloud has taken off and systems continue to scale out further & further.
Fortunately, there are any number of open-source options & paid services out there to handle these tasks. Today’s post however is on something more of a novelty – Logstalgia, otherwise known as ApachePong, which is a neat little OpenGL log visualization tool. It works primarily with Apache & Nginx and similarly formatted log files and will provide a neat little 3d animation with a Pong paddle responding to incoming requests.
Logstalgia – Website Access Log Visualization
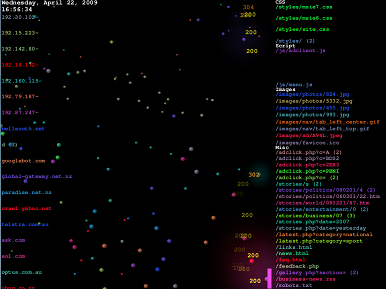
The above video shows Logstalgia in action, with source requests on the left and destination on the right. Frivolous yes, but it is a pretty fun way to visualise webserver access logs, especially for high traffic web server deployments. Logstalgia also provides real-time log monitoring, you are essentially only limited by your imagination.
Logstalgia can be downloaded here: https://code.google.com/p/logstalgia/ – it does require OpenGL support and you can run it on your webserver, but generally you will want to run it remotely eg. on your Windows/Linux/Mac desktop.
Running remotely on *nix you can use the following command for real-time monitoring:
ssh [email protected] tail -f /var/log/apache2/access.log | logstalgia --sync
Note: if you’re running from Windows, you’ll need to be slightly creative and setup something that will allow you to ssh & pipe output to Logstalgia eg. CYGWIN.
While this is little more than an interesting diversion for most users, we have found such visual tools marginally useful from time to time. For example, with our customers running load balanced environments, our system admins utilize the standard monitoring tools available. Like most web gui based monitoring displays, this provides a quick colour coded reference to detect problems (green = ok, red = run to the hills!) and if you are lucky maybe a graph that updates intermittently. Essentially just numbers representing the relevant resources, waiting to tip thresholds and alert admins on any one of our operations monitoring screens.
Whilst this is pretty standard and is our primary monitoring method along with internal & external graphing/monitoring of load balancers, it’s certainly not much “fun”. On top of this we have a simple script which will tail out the various webserver access logs in real-time to Logstalgia.
This allows for a quick visual cue as to the health of a customer’s environment. In the case of customer’s running our load balancing cluster services, they are generally receiving quite high traffic loads and such a visual aid can be extremely useful. If Logstalgia is glowing white with requests going crazy, then it’s a pretty good indicator for one of our admins to give it some extra attention. Even if there is little to worry about it allows for a far more proactive approach and it certainly looks pretty when a high traffic environment is serving a huge amount of users.
Anything that brings the mundane reality of trawling through log files closer to the bigscreen representations found in big hollywood films like Hackers, Goldeneye or the Matrix is a plus in my book.