Small-Business Guide to Google Analytics – What Data Should I be Using?
Considering the fact that most small companies are actually self-employed people who are operating unincorporated businesses, many of their owners and CEOs are usually not aware that developing a strategy based on regularly updated data and statistical analysis can make a huge difference between success and failure. Naturally, everyone is eager to grow and expand their business, but taking the right steps towards such ambitions can either be costly if you want help on the side, or nerve-wracking and time-consuming if you want to figure things out by yourself. That’s why you need to delve deep into Google Analytics as the data gleaned from this application can be a life saver.
Just like many other Google offerings and additions, this program is entirely free. Version 5 of Analytics is the latest edition and there have been some fairly significant user interface changes, but that shouldn’t interfere with the understanding of its basic purpose – to help you put things into perspective so you could run your business with ease and control.
The Interface and its Basics
When you open up a report for your website, the first thing you see is the Visitors Overview screen. At the top of the report is a chart with information about traffic patterns on your page for the past month. This chart provides you with the ability to choose which date will be shown, or even compare the working days by simply changing the date from a dropdown menu. If, for example, you notice spike in traffic on a certain day, you can create annotations and add them up to a specific date, so you can keep track of what caused such spike in traffic. This option is also useful when experience a sudden drop of traffic, but let’s hope these cases won’t happen as often. Also, on your left hand side, there’s main report navigation where you can see very detailed reports regarding your visitors, or reports on traffic sources, content and conversions. There are also some help links waiting if you encounter any problems.
In the sub navigation, you’ll notice an “Intelligence” link. This is a relatively new feature in latest GA with some of the most important metrics including pageviews, average time on site, visits, bounce rates and other. You can also create alerts of your own, depending on what you find useful for your company. For example, if the number of visits is paramount for your business, you can set this as an alert condition and choose whether you want to be notified by email. As soon as the alert is triggered, you’ll be notified almost in real time. Intelligence can be a very useful tool for tracking issues on your website, sudden changes in traffic, conversions, etc. But first and foremost, you must understand some of the most important metrics to use this tool at optimum efficiency.

Key Metrics to Focus on
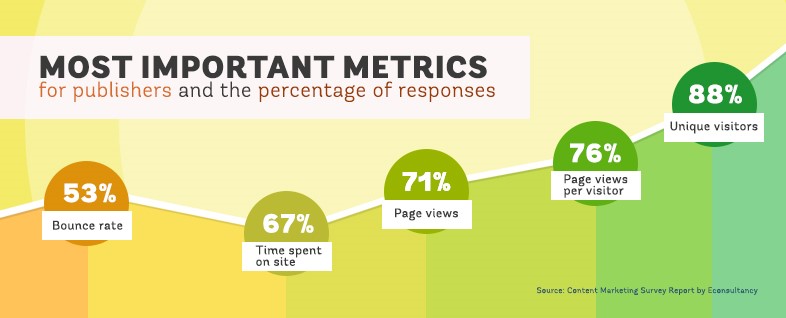
Unique visitors – This is something that is visible on your Visitor’s screen of your report by default. It’s important for calculating the conversion rate and it shows how you convert traffic into dollars. Unique visitors metric can actually be explained via the following equation: Total Conversions / Unique Visitors * 100 = Conversion Rate (%)
Page views per visitor – This percentage represents the average number of pages a visitor views for just 30 minutes between page requests. A report called Average Length of Visit shows the actual average time a visitor spends on your website. High pages-per-visitor count or average length of visit (over 2 or 3 minutes) means that visitors come to your website because they find your content useful and interesting.
Page views – This data shows the total number of pages viewed, as well as the number of users that revisit any of the pages. It is used as an indicator of patterns in traffic and to define why some of the pages are more appealing to the visitors than others. This also helps marketers to decide which pages need to be targeted with calls-to-action, which need more relevant and fresh content, and so on.
This one is basically one of the most important things you should focus on. Fresh, relevant and interesting content is the way to go. If you give someone a reason to spend a certain amount of time on one or more of your pages, be sure that they’ll be sticking around for a while and coming back for more. Which leads us to our next parameter:
Time spent on site – Let’s say for example that you visit a website and, after you see its interface and content, you realize that you don’t want to waste your precious time on that particular page as it has nothing new and useful to offer. “Time spent on site”, in a nutshell, shows how interesting, relevant and informative your content is (or isn’t). This precious data can help you understand what you can do to keep your users in your backyard longer.
Bounce rate – This one measures the quality of traffic your website receives. It tells you how many visitors come to your website, without visiting any other page on it. This way you can tell if your website is reaching the right audience, or as Avinash Kaushik summed it up: “I Came, I Puked, I Left.” Bounce rate applies to first/landing page user visits, while exit rate tells us when exactly the user decided to leave our site. Some of the most common bounce rate scenarios include the back button, typing in the new URL and leaving the session to automatically expire (which happens after 30 minutes). Google suggests that the average Bounce rate is around 40%, however, do bear in mind this is not exact science and many other factors are also affecting all the aforementioned metrics.
At the end of the day, you’ll realize that it is entirely up to you to utilize this tool to your advantage. Since this is one of the most powerful and intuitive web analytics applications out there, the key is to learn how to use it constructively, to understand what this thoroughly processed data is telling you, and to implement acquired statistical knowledge for further development of your business strategy. Everything else is “just” making the traffic flow.
